Do you need a Gantt Chart for your project?
Rabio is a business budgeting software that includes a feature which makes the creation of a Gantt Chart very easy. Read this post on how to create a Gantt Chart with Rapid Business Information Organizer.
What is a Gantt Chart?
According to Wikipedia article a Gantt Chart is:
A Gantt chart is a type of bar chart that illustrates a project schedule, named after its inventor, Henry Gantt (1861–1919), who designed such a chart around the years 1910–1915. Modern Gantt charts also show the dependency relationships between activities and the current schedule status.
A useful video explaining what is a Gantt Chart is available on Rabio resources pages for Project Management
See the video here
Read more for Gantt Charts on Investopedia here
How to create Gantt Chart
The production of Gantt Chart in Rabio requires some easy steps when developing a project. For our example in Rabio, the case describes a demo home construction project from start to finish.
You can check the demo as you can have access following the instructions here.
The Demo Home Construction project in Rabio is having it’s own data structure of centers & categories which is base on the Cost Breakdown Structure followed in the app.
Centers
The centers in the demo project are:
- 1001 – Home Construction Internal Works
- 1002 – Home Construction External Works
Categories
The categories in the demo project are:
- 101 – Planning
- 102 – Demolition
- 103 – Electrical – Plumbing
- 104 – Framing – Drywall
- 105 – Paint
- 106 – Cabinets – Fixtures
- 107 – Doors – Surrounds
- 108 – Cleaning
- 109 – Flooring
- 110 – Trim – Finish Work
- 111 – Garden
- 112 – Parking
Planned & Costs
Rabio is using managers to control various financial aspects in projecsts. In this case there are 2 managers on this home construction demo project which are Planned & Costs.
Planned manager is used for the projected amount per day.
Costs manager represent the real case of home construction per day and actual cost.
Gantt Charts
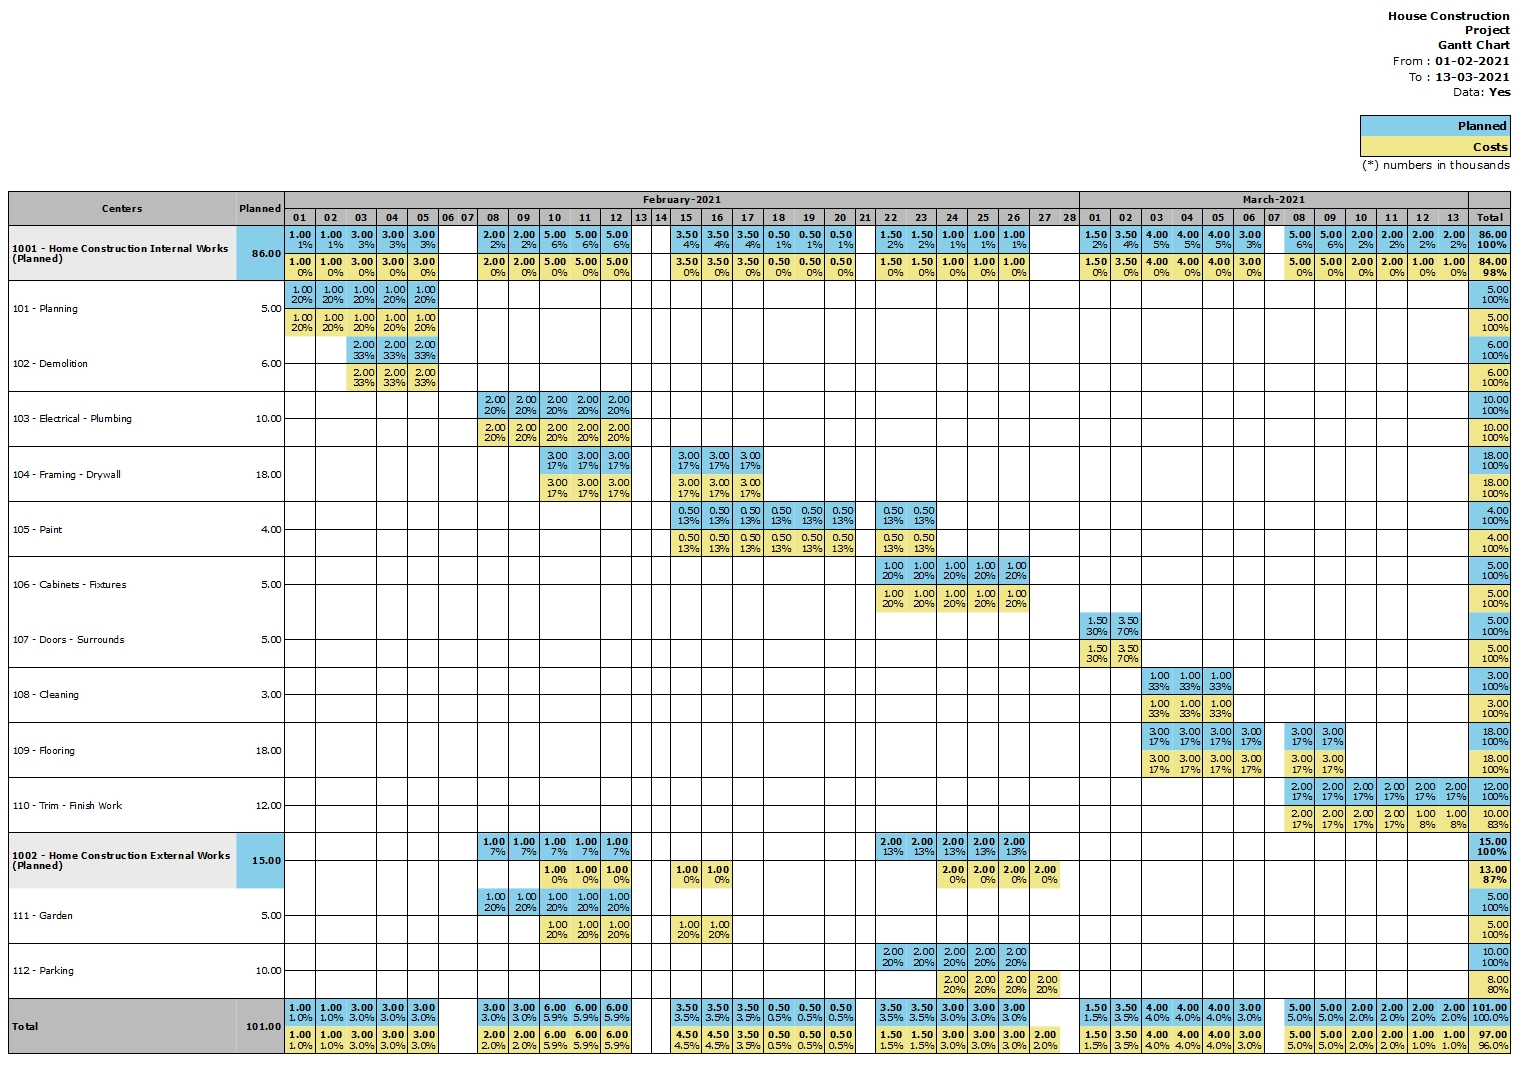
Rabio produces two kinds of Gantt Charts. They are are without data and with data. In the screenshots below you can see the results as they are produced by the reporting system.
Gantt Chart without data

Gantt Chart with data
Reports
The result is an operational project in Rabio. All the reports are functioning great taking advantage of all project data.


Gantt Chart Video Tutorial
A “Create Gantt Chart with Rabio” tutorial video is available.
Gantt Chart Project Demo
Check out the available demo House Construction Project by following the demo instructions here.